
The J-Curve in agile transformation is the predictable pattern where team performance drops before it climbs higher than the starting baseline. It's the same phenomenon Virginia Satir mapped in her five-stage change model in 1991, and most leaders mistake the dip for failure. Those who understand the curve plan for it, measure their way through it, and reach a new steady state that outperforms the old one. Those who don't pull the plug in the trough and restart six months later with a different consultant.
Key Takeaways
- McKinsey finds 81% of respondents in agile units report moderate or significant performance increases, but only on the far side of the dip.
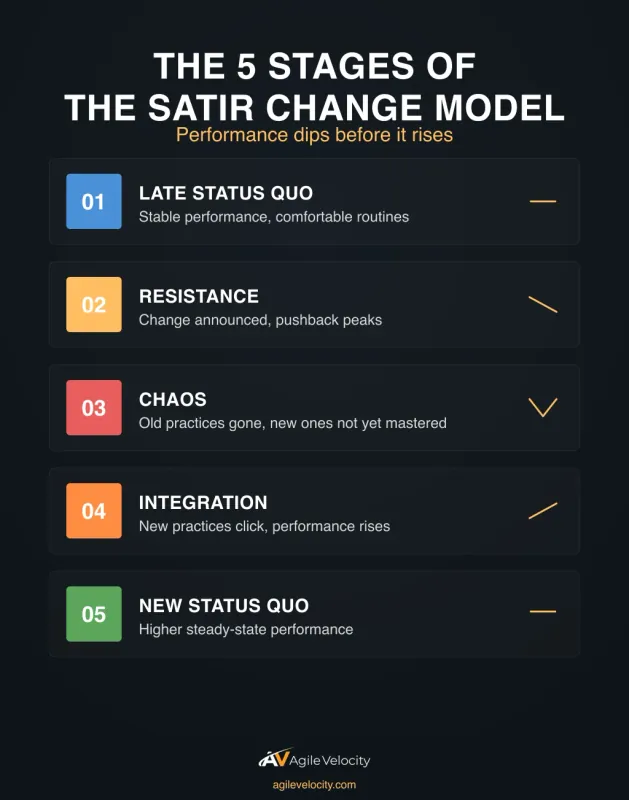
- Satir's five stages name the pattern (Late Status Quo, Resistance, Chaos, Integration, New Status Quo), each needing a different leadership move.
- The performance dip is not the problem. Pulling teams back to old practices during the dip is what creates yo-yo transformations and is the most common reason why agile transformations stall at the executive level.
- Five KPIs tell whether you're climbing or stalled: cycle time, throughput variance, engagement pulse, customer leading indicators, and resolved-vs-owned risk ratio.
- Path to Agility® maps to the curve: Align prevents a deeper dip, Learn and Predict are the climb, Adapt is the new steady state.
What Is the J-Curve in Agile Transformation?
The J-Curve in agile transformation is the performance pattern organizations follow when they adopt new ways of working. Performance dips first. It rises later. The shape on a performance-over-time chart looks like a J. Hence the name.
The J-Curve is not a theory invented for agile work. It shows up in almost every meaningful organizational change: ERP rollouts, M&A integrations, reorganizations, new operating models. What's specific to agile transformation is the steepness of the dip and the length of the climb, both of which depend on how much the organization tries to change at once.
Two frameworks describe the same phenomenon. The J-Curve is the visual shorthand: a line chart with a drop and a recovery. The Satir Change Model, developed by family therapist Virginia Satir in her 1991 book The Satir Model: Family Therapy and Beyond and adapted to organizations by Steven M. Smith in 1997, names the five stages inside the curve. Use the J-Curve when you're explaining the pattern to executives. Use the Satir stages when you're diagnosing where teams are stuck.
The Five Stages of the Satir Change Model
Satir's model breaks the J-Curve into five named stages. Knowing which stage a team is in tells you what to do next. The moves that work in Resistance are the wrong moves in Chaos.
Late Status Quo
This is where performance is flat and predictable. Teams and leaders feel comfortable. There's an unspoken contract about how work gets done. This is also where most transformations are sold, the moment before change begins, when the pain hasn't arrived yet.
Signals you're here: performance metrics are stable, cross-functional friction is low, and the dominant sentiment is "this is fine." It's fine until a foreign element (a new framework, a new competitor, a new market reality) enters the system.
What to do: Do the alignment work before you announce the change. Establish the business outcomes the transformation is chasing. Agree on the baseline numbers. If you can't measure current-state cycle time, throughput, and customer satisfaction now, you won't be able to prove the climb out of the dip later.
Resistance
Resistance begins the moment the change is announced. It peaks when teams realize the change is real and not a drill. This stage looks like pushback on the new way of working, questions disguised as concerns, and slow adoption. It feels personal. It isn't.
Signals you're here: meetings run longer, adoption of new practices is uneven, and you hear "we tried this before" more than once a week. Experienced change practitioners expect this. Inexperienced ones take it as evidence the plan is wrong.
What to do: Listen specifically. Resistance is information. It tells you which parts of the change were explained badly, which parts were genuinely poorly designed, and which parts are threatening to specific roles. Acknowledge the legitimacy of the concerns, fix the genuinely broken parts of the plan, and move forward on the rest. For diagnosing where each person is stuck across the five ADKAR gates (Awareness, Desire, Knowledge, Ability, Reinforcement), see our walkthrough on ADKAR and Path to Agility.
Chaos
Chaos is the trough. Performance drops. Old practices are being abandoned faster than new practices are being mastered. Teams feel incompetent: they were good at the old way, they're not yet good at the new way, and everything takes longer than it used to.
This is where most transformations die. Not because the plan was wrong, but because the dip looks like failure to leaders who didn't plan for it. They panic, they pull teams back to the old practices, and the organization lands exactly where it started, minus trust.
Signals you're here: cycle time is up, throughput is down, meetings feel unproductive, and middle managers are quietly telling their teams to do it the old way "just to ship this quarter." The pressure to revert is enormous.
What to do: Hold the line. Expect the dip, communicate it as expected, and keep measuring. Protect the teams from pressure to revert. This is also where experienced agile coaching earns its fee, not by having answers but by giving leaders the confidence to not panic.
Integration
Integration is when the new practices start to click. Teams stop thinking about the process and start thinking about the work again. Performance starts climbing. The old baseline is still in sight (you haven't passed it yet), but the trajectory is clear.
Signals you're here: cycle-time variance shrinks, teams solve problems without escalating them, and the dominant sentiment shifts from "this is broken" to "this is weird but it's working."
What to do: Codify what's working. Document the practices teams have figured out. Identify the coaches, scrum masters, and product owners who have become internal advocates and promote them. This is the stage where transformation momentum compounds.
New Status Quo
The climb is over. Performance is above the old baseline. The new way of working feels like the way work gets done. Not a program, not an initiative, just work. McKinsey's research on enterprise agility shows that 81% of respondents in agile units report moderate or significant performance increases after their transformations are established, and those units are 1.5× more likely than others to report financial outperformance relative to peers.
Signals you're here: new hires learn the new way as the way, not an alternative. Metrics stabilize at a higher level. Leaders stop talking about the transformation as a thing being done and start talking about it as a thing that's done.
What to do: Guard against regression. Every leadership change, every reorganization, and every cost-cutting cycle is a chance to slip back into the old status quo. Sustain organizational agility by protecting the practices that got you here.
The Five Stages at a Glance
| Stage | What You'll See | The Leadership Move |
|---|---|---|
| Late Status Quo | Metrics stable, "this is fine" sentiment, no pain yet | Publish the baseline, align on Business Outcomes before announcing change |
| Resistance | Longer meetings, "we tried this before," uneven adoption | Categorize concerns into design flaws, info gaps, and status fears — fix the first two |
| Chaos | Cycle time up, throughput down, pressure to revert | Hold the line, deploy coaches to the steepest dips, use ROAM to surface risks |
| Integration | Variance shrinking, problem-solving without escalation | Codify what's working, promote the internal advocates who figured it out |
| New Status Quo | Metrics stable at a higher level, new hires learn the new way | Retire the old tools, guard against regression at every leadership change |
How Long Does the Performance Dip Last?
The honest answer is: it depends on scope, starting maturity, and how well you manage the change. A single team shifting to Scrum can be in and out of the dip in 8–12 weeks. An enterprise adopting scaled agile practices across 50+ teams is typically in the dip for 6–9 months before reaching the Integration stage, and 12–18 months before hitting the new steady state.
Three variables shrink or stretch the dip:
- Alignment at the top. If executive sponsors change their minds mid-transformation, the dip deepens and lengthens. This is what we cover in more detail in our post on why agile transformations stall at the executive level.
- Size of the practice shift. Teams changing one ceremony recover faster than teams changing their whole operating model. Don't try to change everything at once.
- Quality of coaching in the Chaos stage. Teams without experienced coaching spend longer in Chaos because they have to discover the new practices on their own. Teams with embedded coaching move through Chaos faster because someone is shortening the learning curve in real time.
What matters more than the exact duration is the trajectory. If you're six months in and cycle-time variance is still increasing, something other than the J-Curve is happening. You've stalled, not dipped.
The Specific Moves Leaders Make to Shorten the Dip
Most articles on the J-Curve tell leaders to "be patient" and "support the team." That's not useful. Here's what actually shortens the dip.
Before the dip (Late Status Quo):
- Publish the baseline. If you don't know your current cycle time, throughput, and customer satisfaction, you have no way to know whether you're in the dip or below it. Measure before you change anything.
- Align on the Business Outcomes you're chasing, not the practices you're adopting. Scrum is not an outcome. Predictability is an outcome.
- Name the dip publicly. Tell executives: performance will drop for N months before it recovers. This conversation is miserable to have upfront and catastrophic to have midway.
During Resistance:
- Don't argue with concerns. Categorize them. Some are genuine design flaws you should fix. Some are information gaps you should close. Some are loss-of-status fears you should acknowledge without pretending the change won't affect people.
- Move the first wave of teams to the new practices, not all of them. Early wins in a small number of teams produce more momentum than uneven adoption across many.
During Chaos:
- Hold the line on metrics. Do not revert to old practices because a quarter looks bad. Communicate that the dip was expected and show leading indicators trending upward.
- Use ROAM to make risks visible rather than buried. Teams that name their risks during Chaos exit it faster than teams that pretend they don't exist.
- Deploy coaches to the teams with the steepest dips. The teams that are struggling the most are the ones with the highest return on coaching investment.
During Integration:
- Promote the people who figured it out. Internal coaches, product owners, and scrum masters who made the new practices work in real conditions are your most credible advocates for the next wave.
- Start retiring the old tools, processes, and meetings. Leaving them in place tells teams the change isn't permanent.
At New Status Quo:
- Make the new practices the default for new hires. This is the single biggest guard against regression.
- Identify what's at risk of slipping if leadership changes. Write down what must not be lost.
KPIs to Track While You're in the Dip
The difference between a healthy dip and a stalled transformation is not a feeling. It's numbers moving toward recovery. These five are the ones that tell you whether you're actually climbing.
- Cycle time. Time from work starting to work shipped. Expect this to rise in Chaos. It should start falling by Integration. If it's still rising 6+ months in, you have a problem.
- Throughput variance. Week-to-week swing in completed work. Variance drops before throughput itself rises. That's the first leading indicator that teams are finding a stable rhythm.
- Team engagement pulse. A short weekly or biweekly survey capturing sentiment. Sentiment dips in Resistance and bottoms in Chaos. If it keeps dropping past Integration, teams aren't climbing; they're burning out.
- Leading customer signals. Net Promoter Score, first-week retention, support-ticket volume. These lag cycle-time improvements by one to two quarters. Watch them as confirmation the internal changes are reaching customers.
- Resolved-versus-owned risk ratio. From ROAM. A healthy transformation moves risks from Owned to Resolved over time. A stalled one accumulates Accepted risks that never get touched again.
Each of these maps to a Business Outcome in our Path to Agility® approach: cycle time to Speed, throughput variance to Predictability, engagement to Employee Engagement, customer signals to Customer Satisfaction, risk ratio to Quality.
When to Halt vs When to Push Through
Not every dip is a J-Curve. Sometimes the dip is just a dip, and the climb never comes. The distinction matters because it determines whether you hold the line or call a timeout.
| Signal | Healthy J-Curve | Stalled Transformation |
|---|---|---|
| Cycle-time variance | Falling, even while cycle time itself is still elevated | Still rising six months in |
| Team engagement | Stopped dropping, even if not yet rising | Free fall with no sign of bottoming |
| Proof of concept | At least one team visibly in Integration | No team has exited Chaos |
| Customer signals | Flat or slightly positive | Deteriorating across the board |
| Senior practitioner retention | Holding — the people you needed are still here | Losing senior engineers, product owners, team leads |
| Leadership consistency | Objectives stable, measurement frame unchanged | Objectives changed mid-flight, teams measured on both old and new metrics |
Voluntary attrition of senior practitioners is the single most expensive signal of a broken transformation. Leadership changing objectives mid-flight isn't a J-Curve; that's two incompatible operating models running in parallel.
The hardest call is when you're in month four of Chaos, the numbers are bad, and the board is asking if the transformation is working. A simple "yes" or "no" is almost never honest. The honest answer is: "Here's what we expected at this point, here's what's actually happening, and here's what we're tracking to know we're on the climb." If you can't make that case with data, you need better measurement, not a halt.
Facing These Challenges First-Hand?
We've guided 100+ organizations through transformation. Let's talk about what's happening with yours.
Start a ConversationHow Path to Agility Maps to the J-Curve
The Path to Agility® approach is built around the reality that transformation is a curve, not a line. Its five stages — Align, Learn, Predict, Accelerate, Adapt — each have a specific relationship to the J-Curve. The underlying framework — 9 Business Outcomes, 26 Agile Outcomes, 100 Capabilities, 400+ Practices — gives leaders a concrete structure to focus on the practices that will move outcomes during the dip, rather than chasing every practice at once.
- Align is the Late Status Quo work. Align the initiative to the Business Outcomes that justify the dip. Agree on baselines. Without this, the dip is bottomless because no one agreed on where the floor is.
- Learn is the descent and the bottom of the dip. Teams establish foundational practices. Performance drops as they abandon what they know and practice what they don't.
- Predict is the start of the climb. Teams establish a predictable cadence of delivery. Variance drops. The system becomes legible again.
- Accelerate is the climb. Teams shorten time-to-market by optimizing the value-delivery system. Performance passes the old baseline.
- Adapt is the new steady state. The organization changes how it changes; the new status quo becomes one of continuous adjustment rather than episodic reorganizations — the structural definition of a continuous improvement culture.
This is the AV positioning claim: Path to Agility creates the conditions necessary to ensure the dip into chaos and resistance is shallow and short-lived. Outcome-first alignment narrows the scope of what teams must learn at once, and acceptance criteria on each Capability give teams a target instead of a checklist, so the trough is less deep and the climb starts sooner.
Most transformation playbooks treat each stage as a sequential checklist. That's wrong. Align never ends; every new cohort of leaders needs alignment again. Learn never ends; each new capability drops teams back into a small J-Curve. The approach is how you navigate the curve, not a ladder that lets you climb past it.
Frequently Asked Questions
Is the J-Curve the same as the Satir Change Model?
They describe the same phenomenon from different angles. The J-Curve is the visual shape of performance over time: a drop followed by a recovery. The Satir Change Model names the five stages inside that shape (Late Status Quo, Resistance, Chaos, Integration, New Status Quo). Use the J-Curve when communicating with executives who want the picture. Use Satir stages when diagnosing where specific teams are stuck.
How long does the performance dip last in agile transformation?
For a single team adopting Scrum, typically 8–12 weeks. For an enterprise adopting scaled agile practices across many teams, 6–9 months to reach Integration and 12–18 months to reach a new steady state. The range depends on scope of change, executive alignment, and quality of in-flight coaching. Shorter than this is usually cosmetic change, not transformation.
How do I tell if my transformation is failing versus riding the J-Curve?
Look at variance, not just level. A healthy J-Curve shows cycle-time variance dropping before cycle time itself recovers. Team engagement stops falling before it starts rising. At least one team visibly exits Chaos into Integration. If six months in all variance metrics are still worsening, engagement is in free fall, and you're losing the senior practitioners you most needed to keep, you're not in a dip. You're stalled.
What's the single biggest mistake leaders make during the Chaos stage?
Pulling teams back to old practices because a quarter looks bad. The Chaos stage is bad quarters. Reverting doesn't end the dip; it abandons the climb. The organization lands exactly where it started, minus the trust of the people you asked to try. Yo-yo transformations are almost always Chaos-stage reversals repackaged as a new initiative.
Do all agile transformations go through a J-Curve?
Every transformation that actually changes how work gets done goes through some form of the curve. Transformations that report no dip almost always turn out to be surface-level: a new ceremony, a new title, a new tool, but the same underlying operating model. If performance didn't change during the transition, it's unlikely to change afterward either.
The Bottom Line on the J-Curve
Agile transformations fail for predictable reasons, and the most common is leaders mistaking a normal performance dip for a broken initiative. The J-Curve — named by Virginia Satir's five-stage change model four decades ago, validated by McKinsey's research on enterprise agility — is the pattern your organization is going to follow whether you plan for it or not.
The question isn't whether you'll hit the dip. It's whether you'll measure your way through it or panic your way out of it. If your organization is already in Chaos and you need outside eyes on whether the numbers say climb or halt, our Organizational Health Check scores your transformation across the 9 Business Outcomes in about four minutes and shows you where you stand.
Facing These Challenges First-Hand?
We've guided 100+ organizations through transformation. Let's talk about what's happening with yours.
Start a Conversation

