
Flow metrics are the four delivery measurements transformation leaders need when velocity and story points stop telling the truth. Cycle Time, Throughput, Work In Progress, and Work Item Age describe how work actually moves through your system — independent of estimation accuracy, framework choice, or whether teams are running Scrum, Kanban, or SAFe. For transformation leaders, the value is not the metrics themselves. It is the ability to connect what teams are doing to the Business Outcomes the executive team cares about.
This guide is written for the leader who has to defend a metric change to a CFO who has been reading velocity charts for five years. The how-to-introduce-it problem is the one most flow metrics content skips.
Key Takeaways
- Flow metrics replace velocity because they measure delivery as the system actually behaves, not how teams estimate it.
- The four core flow metrics are Cycle Time, Throughput, Work In Progress, and Work Item Age. Each maps to a specific Path to Agility® Business Outcome.
- 70% of large-scale transformations fail to sustain results. The most common metric failure is reporting velocity trends to executives who need outcome trends.
- Expect 6–12 weeks before flow metrics yield reliable trends. The issue is data volume, not flawed metrics — once enough cycles have completed, signal emerges. Changes to the system that the metrics surface are then what produce the J-Curve in delivery performance.
- The hardest part is not the math. It is removing velocity from the executive dashboard without losing the trust you spent two years building.
Why Velocity Stops Working at the Leadership Level
Velocity was designed as a team-internal forecasting tool. It was never designed as an executive metric. When leadership starts asking "Is velocity going up?" three things break.
First, teams optimize for the number rather than the work. Story points inflate. Backlog refinement starts including carry-over from prior sprints. The line on the chart goes up and delivery does not.
Second, velocity is incomparable across teams. A team measuring at 32 and a team measuring at 18 may be delivering identical value at identical speed; the points just mean different things. Executive comparison creates the wrong incentives in both directions.
Third, velocity reveals nothing about whether the system is healthy. A team can hit a steady velocity for a year while cycle time degrades from 4 days to 14 days, work-in-progress quietly doubles, and the oldest open item is now 90 days old. The velocity chart looks great. The transformation is failing.
Flow metrics fix all three problems because they describe the work itself, not how the team estimated it.
The Four Flow Metrics That Replace Velocity
There are four flow metrics every transformation leader should understand. Each answers a question that velocity cannot.
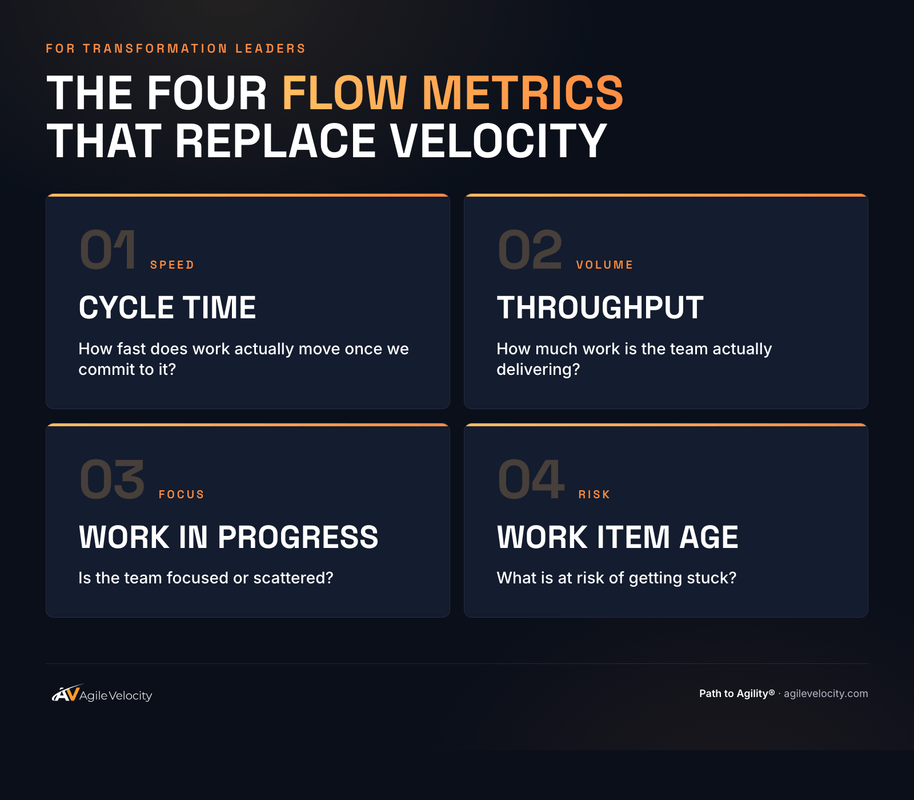
Cycle Time
Cycle Time measures the elapsed time from when work starts to when it is done. It answers: how fast does work actually move once we commit to it?
For leaders, this is the speed metric. A trending decrease in cycle time is the most direct signal that delivery is accelerating. Unlike velocity it cannot be inflated by estimation games. The clock is the clock.
Track it as a distribution, not an average. The 85th-percentile cycle time tells you how long work takes on a bad day. That is the number you commit to executives.
Throughput
Throughput measures the number of work items completed per unit of time, typically per week or per sprint. It answers: how much work is the team actually delivering?
Throughput replaces velocity as the volume metric. The advantage is that one work item is one work item. There is no points game. Both volume and stability matter, and they tell different stories: a steady throughput of 12/week indicates better system health than a volatile throughput averaging 18/week, but if each work item delivers comparable business value, the higher average is the better business outcome. Track both and report both.
Work In Progress
Work In Progress (WIP) measures how many items are open at any given moment. It answers: is the team focused or scattered?
WIP is the leading indicator. When WIP rises, cycle time will rise next. When WIP falls toward a sustainable level, throughput stabilizes and cycle time drops. For transformation leaders, WIP is the single best diagnostic of team health that does not require an interview.
Work Item Age
Work Item Age measures how long currently in-progress items have been open. It answers: what is at risk of getting stuck?
Of the four, this is the metric most often missed. It surfaces the work that is silently dying — items that started three weeks ago and have not moved. A throughput chart will not catch this. You can start to see the problem as soon as a work item exceeds the team's average cycle time. The four flow metrics are correlated leading indicators — a rising WIP usually pulls Work Item Age up with it, and a movement in any one is an early signal for the rest, so a single dashboard read tells you more than any one metric alone.
Where Does Your Organization Actually Stand?
18 questions. 4 minutes. Get scored across 9 Business Outcomes and see exactly where to focus.
How Flow Metrics Connect to Business Outcomes
Flow metrics are not the goal. Business Outcomes are. The job of the transformation leader is to connect the two so the executive team understands what is being measured and why.
The Path to Agility® approach is built around nine Business Outcomes. Flow metrics map cleanly onto three of them.
| Business Outcome | Primary Flow Metric | What It Proves |
|---|---|---|
| Speed | Cycle Time (85th percentile) | Time from commit to delivery is shrinking |
| Predictability | Throughput stability | Delivery cadence is reliable not volatile |
| Quality | Flow Distribution (defect %) | Defect rework is not consuming capacity |
Quality is the one most teams under-track. Flow Distribution measures the percentage of completed items that were defects, debt, or risk work versus features. A team delivering high throughput where most of that throughput is defect rework is not delivering speed. They are delivering rework.
When you report to executives, lead with the Business Outcome and follow with the flow metric that proves it. Do not lead with the metric. The CFO does not need a Cycle Time tutorial. They need to know that Speed is improving and what the evidence is.
Introducing Flow Metrics Without a Mutiny
Most published flow metrics content explains what to measure and skips the harder problem: how to introduce these metrics in an organization that has been running on velocity for years. This is where transformations stall.
Three rules.
Run flow metrics in parallel for one full quarter. Do not remove velocity reporting on day one. Add cycle time, throughput, WIP, and work item age alongside the existing dashboard. Let executives see both. The contrast — velocity flat while cycle time degrades — does the convincing.
Tie each metric to an outcome leadership already cares about. Cycle Time is not "an agile metric." Cycle Time is "how fast we deliver." Throughput is not story points 2.0. Throughput is "how much we ship." The framing matters more than the math.
Use the ADKAR framework to walk leadership through the metric change. Awareness of why velocity fails. Desire to see something more accurate. Knowledge of what flow metrics measure. Ability to read the new dashboard. Reinforcement when the new metrics catch a problem velocity missed. The metric switch is itself a change that needs change management.
If you skip these three steps, the new metrics get added, ignored, and quietly removed within two quarters. The window closes.
What to Track During the J-Curve Dip
Transformation performance dips before it improves. This is the Satir Change Model — the J-Curve — and it shows up in flow metrics before it shows up anywhere else.
Three signals to track during the dip.
WIP trends, not absolute WIP. During the chaos phase WIP often spikes as teams take on new practices without finishing old work. A rising WIP trend lasting more than 4 weeks is the first warning that the dip is becoming a stall.
Throughput stability, not throughput height. Volatile throughput (a sprint of 14 followed by a sprint of 4) signals teams are still finding their cadence. The goal during the dip is not high throughput. It is reducing variance.
Work Item Age distribution. As teams adopt new practices, items that started under the old process can get abandoned. Tracking the age distribution catches this. If your oldest in-progress item is now older than your average sprint length, the system has hidden carry-over.
Reporting these three signals to executives during the dip is what protects the transformation. It tells the story: performance is dipping as expected, the system is finding its new equilibrium, and here is the evidence that the equilibrium is forming.
The Path to Agility® approach is designed to keep this dip shallow and short-lived, but you still need flow metrics to know when you're in it and when you're coming out.
Track Your Transformation in Real Time
Path to Agility Navigator maps your teams against 100 capabilities and shows exactly where to invest for the outcomes you need.
Reporting Flow Metrics to the Executive Team
Flow metric dashboards proliferate. Executive reports should not. The transformation leader's job is to compress the four flow metrics into something a CFO can read in 90 seconds.
The four-metric one-pager works:
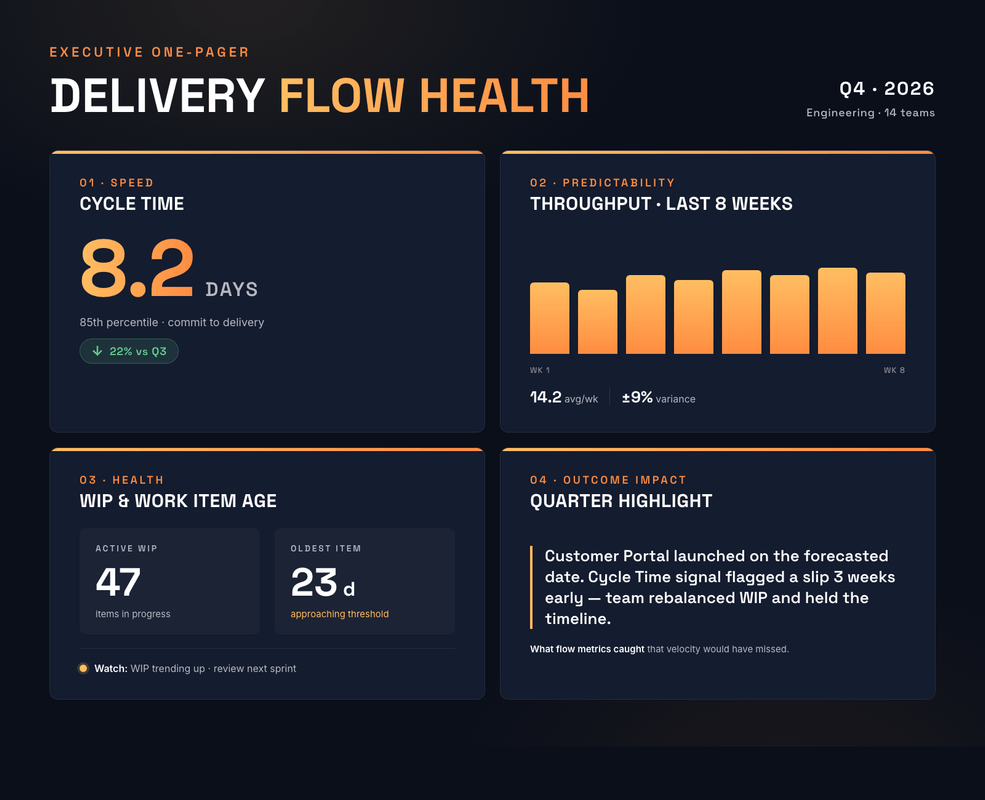
- Speed — Cycle Time 85th percentile, this quarter vs last quarter
- Predictability — Throughput trend chart, last 8 weeks
- Health — WIP and Work Item Age, current snapshot
- Outcome impact — One named delivery this quarter that the metrics predicted accurately, OR one missed delivery the metrics flagged early enough that leadership could intervene
The fourth row is the one most reports miss. Without it, flow metrics become another set of numbers. With it, they become evidence. The CFO does not remember the cycle time number. They remember "we shipped the X feature on the date we forecasted because cycle time told us we were on track three weeks earlier than velocity would have."
Avoid the dashboard trap: adding more metrics until executives stop reading. Four numbers, one outcome story, every report.
Frequently Asked Questions
What is the difference between flow metrics and agile metrics?
Agile metrics is a broad category that includes velocity, story points, sprint burndown, and cycle time. Flow metrics is a specific set — Cycle Time, Throughput, WIP, and Work Item Age — that measure work as it moves through the system rather than as the team estimates it. Flow metrics are a subset of agile metrics designed for executive reporting and outcome connection.
Should we replace velocity with flow metrics?
Eventually yes, but not immediately. Run them in parallel for one quarter. Velocity has team-internal value as a planning tool. The change is removing velocity from the executive dashboard, not abolishing it inside the team.
How long before flow metrics become reliable?
Plan for 6–12 weeks before there is enough data volume to identify real trends. The data isn't unstable — there's just not yet enough of it. During this window the metrics are still useful (they reveal the WIP and aging issues that velocity hides), but trend lines are not yet meaningful. Stable trends emerge once teams have completed enough cycles for cadence to settle.
Do flow metrics work outside Scrum?
Yes. Flow metrics are framework-agnostic because they're renamed lean-manufacturing measurements — they apply to any process in any business, not just software delivery. They work identically in Kanban, Scrum, SAFe, and pure team-flow systems. This is part of why transformation leaders favor them: they survive scaling framework changes without resetting the measurement baseline.
How do flow metrics fit with SAFe?
SAFe explicitly adopted flow metrics in version 6 as part of its Lean Portfolio Management guidance. The four core flow metrics this guide describes are the same four SAFe uses. The difference for transformation leaders is the connection to Business Outcomes. That linkage is not framework-specific.
The Bottom Line
Velocity is a team tool that got promoted into an executive metric and broke under the weight. Flow metrics replace it because they describe how work actually moves (speed, volume, focus, and aging), not how teams estimate it.
For transformation leaders, the work is not learning the four metrics. It is connecting them to Business Outcomes the executive team already cares about, introducing them with the change management discipline of an agile transformation itself, and reporting them in a format that survives a 90-second executive review.
When velocity stops working, flow metrics are what is on the other side. McKinsey research finds that transformations fail roughly 70% of the time. Metric failure (measuring story points when executives need outcomes) is one of the failure modes hiding inside that statistic. The fix is not more metrics. It is these four — Cycle Time, Throughput, WIP, and Work Item Age — reported as evidence of Business Outcomes the executive team already cares about.
Facing These Challenges First-Hand?
We've guided 100+ organizations through transformation. Let's talk about what's happening with yours.
Start a Conversation

