Blog
Top 10 Challenges in Today’s Business Landscape and Why Agile Offers Solutions
By: Sally Tait | Apr 01, 2024 | Agile,
Leadership

In the dynamic world of business, leaders and teams face evolving challenges that demand innovative, flexible, and efficient solutions. Agile training and transformation offer a beacon of hope, guiding organizations through these turbulent times with practices that enhance adaptability, customer satisfaction, and team morale. Here’s a look at the top 10 challenges business leaders and teams face today and how Agile principles can address them.
Blog
Webinar Recording: Mastering the Art of Integration: Strategic Planning and AOP with SAFe® for Agile Organizations
By: | Dec 04, 2023 | Agile,
Leadership,
Lean Portfolio Management,
SAFe

Recently, Dave Gipp partnered with Adam Mattis of Scaled Agile to discuss strategic planning.
Titled, “Mastering the Art of Integration: Strategic Planning with SAFe® for Agile Organizations”, the webinar explored the challenges many companies face when bridging the gap between strategy and execution.
Predicting results is extremely difficult in any environment, and Adam and Dave sought to acknowledge this difficulty while providing real advice around how to pivot and respond to market changes using improved efficiency and allocation of resources.
Complete the form for a copy of the dictionary of strategic planning terms mentioned throughout the webinar.
The webinar was followed by a robust Q&A discussion with webinar attendees. Here’s the full transcript of the Q&A:
If you’d like to watch the full webinar recording, click here.
Blog
Benefits of Asking Powerful Questions Over Giving Directives
By: Andy Cleff | Nov 09, 2023 | Agile
In this article, we dive into a transformative topic that could redefine the way you approach leadership—asking questions. Inspired by the leadership insights shared by transformation coach Kim Antelo, we’ll explore the power of leading with questions, unlocking your team’s potential, and creating an environment that fosters collaboration, innovation, and personal growth.
In a world that’s constantly evolving, where business decisions need to be made swiftly and decisively, the idea of leaders asking questions might seem counterintuitive. However, as Kim brilliantly outlines, this approach holds the key to unleashing two times the team’s capability, improving engagement, and boosting profitability. Let’s break down the key takeaways from the video and explore some practical improvement ideas for implementing this approach in your own leadership journey.
Blog
Harnessing Monte Carlo Simulations for More Accurate Sprint Planning
By: Agile Velocity | Oct 11, 2023 | Agile,
Kanban,
Scrum

When it comes to Sprint Planning in the Scrum framework, precision and predictability are paramount. Yet Sprint Planning based on story points and average velocity, while popular, has inherent flaws.
Blog
How to use Flow Metrics to Manage the Madness and Drive Action [Video]
By: | Aug 30, 2023 | Agile,
Agile Metrics
In this quick video, Enterprise Coaches Colleen Johnson and Andy Cleff discuss…
- The right way to use flow metrics
- Difference between leading and lagging indicators
- 4 metrics + 1 bonus to help you measure flow at the team, system, and portfolio level
If you’d like to learn more about Flow Metrics, contact us..
Flow Metrics Video Transcript
Andy Cleff
Hello, I’m Andy Cleff and I’m joined today with Colleen Johnson. Both of us are transformation coaches with Agile Velocity.
We want to talk today about organizational agility and specifically, metrics that matter when optimizing for the flow of value through your system.
Colleen Johnson
Absolutely. We’re going to look here at how you can use metrics to help manage the madness. What that means for us is using and tracking metrics that are going to drive your team to some action, not just creating dashboards or creating reports or red light, yellow light, green light type of information.
We want metrics that drive action. So what can we do to leverage the data that we can collect to help us actually manage the madness?
Andy Cleff
I love that subtitle. So we’re going to introduce four core metrics plus one bonus metric that’ll help you measure flow at the team, system, or the org level.
Colleen, let’s ping-pong back and forth.
I’ll do the first one: WIP [Work in Progress] –the number of work items started but not finished.
This is a leading indicator and we’ll unpack the difference between leading and lagging in a moment.
Colleen Johnson
The next one’s throughput: the number of work items finished for a specific unit of time, You’re probably already tracking throughput in some fashion.
This often looks like how many items are completed for a sprint or for API. This is typically a lagging indicator because it’s telling us about something for work that’s already completed.
Andy Cleff
Number three, another leading indicator, how come I’m getting all the leading indicators?
Work-item age. It’s the amount of time that’s lapsed between when a work item started and our current date.
Colleen Johnson
Our last one for our flow measures is cycle time: the amount of a lapse time between when we started work on an item and when it finished.
So how long does it take for us to complete a user story or a feature or an epic. This is also a lagging indicator because it’s on work that is already completed.
Andy Cleff
So there you have the four key flow metrics: WIP, throughput, work-item age, and cycle time. We promised you a bonus. The bonus is one of my favorite things to look at and yes, you can measure the human element in your system.
We often talk about employee engagement. There’s a rather distressing poll that comes out of Gallup every year or every couple of years, and the recent one, I think it’s 2023 data, says about 23% of employees are actively engaged at work
So do the math.
There’s a huge chunk that are not satisfied, not willing to go that extra mile, not really passionate about what they’re doing.
I think that’s probably a whole other talk in itself, but they can be measured and you can roll that into your core metrics.
Colleen Johnson
I love that. When you think about that employee element too, think about the turnover that you mentioned or how frequently people are leaving the organization.
That may vary right? Based on the economic climate a little bit, but it’s such an important indicator of the culture and the larger ecosystem. How long do people stay?
Andy Cleff
Well, that’s lagging. By the time they’ve left, it’s a little bit late. The leading indicators are employee referrals and offer acceptance, of course. You can do feedback on a regular basis, one-on-ones, team retros and larger surveys.
And we’re in creative knowledge work so team learning opportunities, team learning logs, all these things are great.
Leading indicators give you an idea of what might happen next.
Lagging indicators–they’re the rearview mirror. I don’t know about you, Colleen but I like to look through the windshield.
Colleen Johnson
As we start to think about these, I mentioned the concept of what data can we make actionable. It’s not to say that those lagging indicators aren’t still actionable, but we tend to look at lagging indicators in things like retrospectives.
Those are the things that help us figure out process changes and policy changes.
They help us drive how we work and how we’re organized around our work. As we start to think about those leading indicators, those are the things that help us figure out what action to take immediately.
If you think of a signal, an alarm, that’s our signal that something needs to change right away.
What’s awesome is we start to break down these different types of measures and how we use them so that they work at every part of the business.
So this works at the team level, this works at the system level, this works at the portfolio level–whatever you would like to call those levels.
There’s a lot of flavors of scaling out there. So it could be stories, features, epics. It could be the team, system, portfolio.
You had an interesting one too, outcomes, opportunities, and experiments, right?
Whatever level that you’re breaking up your work and organizing your value around these metrics are still going to work.
Andy Cleff
The things that you need to get started are really simple.
You need a definition of workflow: You need to know when it starts and when it is complete. That’s it. Two data points for any of these work items in your system.
Notice we haven’t mentioned size, complexity, or effort.
It’s a paradox but it works.
So, starting and finishing… is helpful. If you’ve used the definition of ready and definition of done, they’re starting points, they can help you understand what it means to pull work items into and start and when it’s done so that you can actually finish your items.
Two points: When we started and when we finished it, that’s all you need to gather.
Colleen Johnson
Super fun fact about starting date and ending date. If you are unfortunately calculating this manually or with the spreadsheet, and not in a tool, you’ll want to add one day.
If you’re subtracting the end date from your start date, you always do a +1 because if I start something today and I finish it today, my cycle time on that particular item isn’t zero. It’s one day.
If you’re calculating it manually for cycle time, at least, always, remember to add 1 day.
When we start digging into what to do with all this data, we start to think about how to make this data actionable.
We’re going to focus on cycle time and throughput.
We can use start date and end date to tell us how long something took, but we can also start to use it to figure out our throughput.
So how many items are we getting done for a given period of time?
You can pick what that interval looks like. The easiest way to get started is to probably look at how many items we complete every day.
For a lot of teams, that’s not a whole number.
It might be like we get 0.4 stories done every day because it’s going to look at how many over time.
What does that throughput rate look like?
What’s great about throughput is we can start to use that to build what’s called a Monte Carlo simulation. As Andy said, we don’t need to estimate, we don’t need to look at complexity. We don’t need to look at hours or any of the typical ways that we go about trying to figure out when something’s going to get done. We can actually leverage our past throughput data to run a simulation to help us start to see when future work will be completed.
And you don’t need a ton of data for this.
You really only need about 10 completed work items and those completed work items could be stories, your completed work items could be features.
So like we said, we can apply this kind of simulation and ability to forecast to any type of work or level of work in our organization. That throughput and the ability to run the simulation against how many work items were completed is what is going to give us the ability to forecast when future work items are going to be done.
Andy Cleff
So this might be a leap of faith for some of you, but you don’t have to measure. You can keep measuring some of these things if you want to.
But we encourage you to overlay the systems.
Don’t stop, just add. You don’t need size, complexity, hours, et cetera.
And you don’t need hundreds or thousands of data points. You just need discrete work items, when it started, and when it finished and it can be at the team level.
If it’s part of a larger workflow, because there are handoffs, you can scale your measurements. What you get from this, if you take the leap and believe us for a moment, the Monte Carlo simulations give you the probability of a variety of outcomes.
If you’ve been in your financial service provider’s office, you know, you have an 85% chance that you’ll get this sort of range of return. It’s very similar for both. Cycle time is useful for a single work item.
You know, 85% confident that this epic, feature, or story will be done in two days, 10 days, 30 days, or less. If you want to look at multiple things, you use the throughput number. It’s the same thing, you get a range and a probability.
Why is this important? Why is this different?
Many of us are used to what we call a deterministic forecast: X on Y promise. That doesn’t work that way in these complex systems, teams or teams of teams.
My favorite metaphor is that, they [teams] are not wristwatches, they are gardens.
They are, they’re not dreamliners that you can take apart and put back together and they’ll always work.
Rainforests cause and effect are loosely correlated and yet you only know about it in retrospect.
If you want to look to the future, take a small number of data points, run some simulations and give yourself some probability and insights into what your system is capable of doing.
Colleen Johnson
I love that, Andy. This goes far beyond just trying to forecast when work is going to be done, whether it’s like you said, a single-item forecast or a multiple-item forecast. This also really helps us figure out where we can improve.
One of the key things we talk about when we’re looking at our metrics from a flow metrics perspective is how stable our system is.
I was in a conversation earlier today where somebody was asking me how we measure predictability.
I said, “I think you’re asking the wrong question.”
We want to ask how stable our system is because a stable system produces a more predictable outcome.
When we look at system stability, those are things like, are we keeping a consistent amount of work in progress over time. Do we have less variability of our cycle time and less variability of our throughput data so that we know that we’re working in an optimal operating capacity all of the time?
When those things start to come together, we get more predictable. It also helps us, as I mentioned, see those opportunities to improve those lagging indicators.
We talked about throughput and cycle time where we see something that’s way outside of what we expected that helps us, go back and say, do we need to change something?
Maybe we need to change some of our workflow policies or change how work is entering our system to make sure that we’re addressing some of that risk earlier in our process.
Andy Cleff
It shines a light on so many opportunities. One of the beautiful lenses that came to us via Dominica DeGrandis, was the “thieves of time”, when you start visualizing your cycle time, your throughput, your work item age, or your WIP, you will see some amazing things.
You will notice you have too much WIP, which is a vicious feedback cycle. You have too much. So you’re waiting. But what are you gonna do? You’re gonna go start something else. It’s endless.
When you see work-item age climbing up, chances are you have external dependencies in teams of teams or even within a team.
Other things that show up are unplanned work, conflicting priorities, neglected work, all these things are gonna rear their ugly heads.
Now you have some data and some feedback loops.
When you begin to try experiments, reduce your batch size, reduce your WIP, visualize your dependencies.
Even though these are lagging indicators, you will see soon enough in a couple of cycles, changes, and then you can amplify the good, share it across your system.
Colleen Johnson
We hope we gave you a few ideas on how you can use flow metrics and employee engagement to manage the madness.
If you’re interested in more content from us, check out our YouTube channel from all of the coaches at Agile Velocity for more tips and tricks on how to leverage flow metrics and other Agile Outcomes and Agile Practices to help better your organization.
Blog
Video: Mission Possible – Agile Predictability
By: | Jul 12, 2023 | Agile,
Agile Coaching,
Video
According to the 16th annual State of Agile report, 44% of respondents reported that achieving predictability is how they prioritized the implementation of Agile ways of working. This was the #2 reason. Yet, it’s common to hear that you can’t have fixed delivery dates in this type of environment. What gives?
Enterprise Coaches Colleen Johnson and Randy Hale discuss and debate if Agile predictability is achievable, different methods of getting there (and why some of them don’t work), and how important it is for organizations to align on what they need to be predictable.
The Agile Release Train (ART) is a long-lived team of agile teams that, along with other stakeholders, incrementally develops and delivers value. It provides alignment and helps manage risk and dependencies by providing program-level cadence and synchronization. This Agile Release Train cheat sheet breaks down the purpose, principles, events, and members of the ART.
The Purpose of an Agile Release Train
The purpose of the Agile Release Train is to deliver value through a synchronized cadence. The ART is made up of cross-functional teams that enable a continuous flow of value delivery. It brings together all the people that are needed to plan, execute, and deliver valuable products and solutions.
The Principles of an ART
The ART operates on a set of principles defined by the Scaled Agile Framework (SAFe®):
Dedicated people
-
- Most of the members of the ART are dedicated full-time to the ART, focusing on the continuous delivery of products and solutions.
Synchronized cadence
-
- All teams on the train have the same cadence of iterations, usually two weeks. It provides a synchronized start and stop time, allowing predictable delivery of smaller product/solution increments.
- There is an additional cadence of a Program Increment (PI) usually 10 – 12 weeks that enables the organization to make larger solution delivery more predictable.
PI Planning
-
- The expected outcome of this event is that all of the ART members have a shared understanding of the PI objectives, visibility on work needed to accomplish the objectives, and have surfaced risks and dependencies. The entire release train comes together during this process to enable a team of teams to commit to achieving the objectives with confidence and set reasonable expectations with stakeholders.
- Program risks are discussed openly and remediation efforts are public. Dependencies are not merely identified, they are discussed with all involved parties, and agreed-upon actions are captured and visualized on the program board.
Innovation and Planning (IP) iteration
-
- Occurs at the end of every PI to allow the train to innovate and learn. Teams are highly encouraged to dedicate time to continuing education and preparing for the next PI Planning event.
Inspect and Adapt
-
- Held at the end of the PI, teams showcase completed and integrated solutions and review Program Metrics along with a structured problem–solving workshop to reflect on improvement ideas.
- This is a great opportunity for leaders to engage, take ownership, and support resolution of organization-level impediments that teams are unable to fix on their own.
Develop on cadence, release on demand
-
- Teams on the ART develop on a synchronized cadence and release on demand. Decoupling deployment and release from the development cadence accelerates the delivery of a continuous flow of value to the market and customers. It also provides flexibility to the organization with how and when to release to customers.
ART organized around value
-
- Teams in an ART are organized around a common goal of providing continuous value to the customer. The teams are designed within the foundations of Team Topology. The four fundamental types are
- Stream Aligned Team – Stream-aligned teams focus on a single, impactful stream of work. It can be a single product or service, a single user journey, or a single user persona. The team is empowered to build and deliver customer or user value as quickly, safely, and independently as possible, without requiring hand-offs to other teams to perform parts of the work.
- Complicated Subsystem Team – A complicated-subsystem team is responsible for building and maintaining a part of the system that depends on specific skills and knowledge. Most team members must be specialists in a particular area of knowledge to understand and make changes to the subsystem.
- Platform Team – Platform teams enable stream-aligned teams to deliver work. While the stream-aligned team maintains full ownership of building, running, and fixing an application in production, the platform team provides internal services that the stream-aligned team can use.
- Enabling Team – The enabling team seeks to primarily increase the autonomy of stream-aligned teams by growing their capabilities with a focus on problems, rather than solutions.
- Teams in an ART are organized around a common goal of providing continuous value to the customer. The teams are designed within the foundations of Team Topology. The four fundamental types are
Agile Release Train Roles and Responsibilities
Each member of the ART plays a significant role:
 Customers/Users – Are the ultimate beneficiaries of the Product/Solution being developed by the agile teams.
 Business Owners – Are primarily responsible for business, technical governance, and the ROI of the product/solution being developed by the agile teams. These are the individuals that are accountable for the outcomes and weigh in on important tradeoff decisions.
 RTE – The Release Train Engineer is responsible for coordinating the PI events and ART Sync. The RTE is the Chief Scrum Master of the train, guiding the smooth operation of the ART by escalating impediments, visualizing cross-ART dependencies, and managing risks. Great RTEs also coach and provide advice to the train and its stakeholders, continuously improving the overall health and performance of the train.
 Agile Teams – Are a set of cross-functional groups of 5-11 individuals who define, build, test, and deliver an increment of value in a short time box. This includes the Scrum Master and Product Owner.
 Product Community – Helps define, guide, and support the building of customer-desired and sustainable products/solutions.
 System Team – Assists ART in delivering value by providing Infrastructure, enabling integration, and deployment.
ART Events Cadence and Synchronization
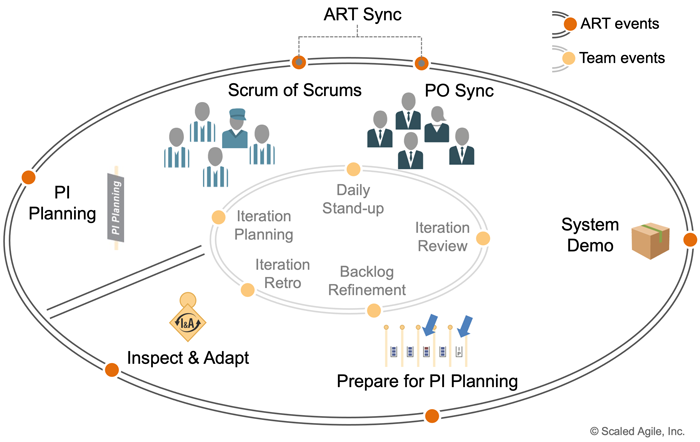
ART Events:
-
- SOS – Once a week (30 – 60 mins)
- POSync – Once a week (30 – 60 mins)
- System Demo – Atleast once every two weeks (30 – 60 mins)
- PI Planning Prep – Once a week (30 – 60 mins)\
- Inspect and Adapt – Once every PI (3 – 4 hours)
- PI Planning – Once every 10 weeks (2 days)
Team Events:
-
- Daily Stand Up – Every Day (15 mins)
- Iteration Review – Once every two weeks (30 – 60 mins)
- Backlog Refinement – At least once every week (30 – 60 mins)
- Iteration Retro – Once every two weeks (30 – 60 mins)
- Iteration Planning – Once every two weeks (2 hours)
PI Planning Prep – Is a collaborative meeting to continuously prepare for the upcoming PI. The product community works closely with the Business, Architecture, and Delivery groups to prioritize and refine the next set of Features; Create any wireframes or mockups needed, and decompose Features into stories for the upcoming PI.
PI Planning – Is a two day planning session where the entire ART comes together to align development to business goals, commit to the team and program objectives for the PI, identify dependencies and risks, and come up with a plan to address those.
Inspect and Adapt – Is a workshop, held during the IP Sprint that includes a final System Demo, review of quantitative and qualitative metrics, and a Problem-Solving Workshop. This event is fundamental to the principle of relentless improvement of an ART.
ART Sync – Is a combination of PO Sync and Scrum of Scrums
-
- PO Sync – Promotes visibility into progress towards meeting PI objectives, reviews scope adjustments/tradeoffs, and assesses program risks.
- Scrum Of Scrums (SOS) – Facilitated by the RTE, SOS helps to coordinate dependencies across the ART and provides visibility into progress, impediments, or learnings across the ART.
Tips for a Successful ART
The success of an Agile Release Train depends on three key aspects:
1. Successful Launch
-
- Train the leaders, change agents, and team members
- Identify the first ART through a Value Stream Workshop
- Define the ART and its structure
- Leaders should have a clear message about why the ART is being formed and the shared goal(s) they intend the align the ART around
- Staff critical roles like RTE, System Architects, and Product Managers along with the typical Scrum roles like Scrum Master, Product Owners, and Development Team members
- Set the date of the first PI Planning and communicate it
- Execute the first PI with the goal of dedicated IP Sprint at the end of the PI
- Close the PI with an Inspect and Adapt workshop
2. Continued Support
-
-
- Any change is hard. Members that make up an ART and those that are required to support it might feel that the decision was imposed and will resist the change. Leadership should be crystal clear on the intent, transparent with communication, and supportive of the angst many might feel. Leaders at all levels should try to be available to guide members of the ART.
- Leaders should model behavior by moving away from directing the day-to-day work in support of the Product Owner and agile team, to defining the work, attending the Inspect and Adapt workshop, taking ownership of impediments, sharing progress on impediment removal, and broadly communicating team/ART successes.
-
3. Celebrate Wins
-
- Lack of celebration is one of the top reasons why teams are not motivated and is a wasted opportunity. Celebrating small wins helps build momentum, improve morale, and reward hardships.
Every organization is different and one size does not fit all. While SAFe implementation is fairly straightforward, being overly prescriptive isn’t recommended. Leaders should focus and invest in skilled people and empower teams for successful implementation.
If you’d like to learn more about ARTs or talk about getting the best results from your SAFe implementation, get in touch with Agile Velocity today.
Planning is indispensable for all agile teams to visualize, align, adjust, and implement. No matter how well-documented the plan is, it often requires pivoting and adjusting. Adopting Iterative Planning at various levels helps teams stay focused and address impediments in a timely manner.
We created this easy infographic to outline the different levels of Iterative Planning, their objectives, and the tools and techniques to use.
(click here to enlarge the infographic for download)
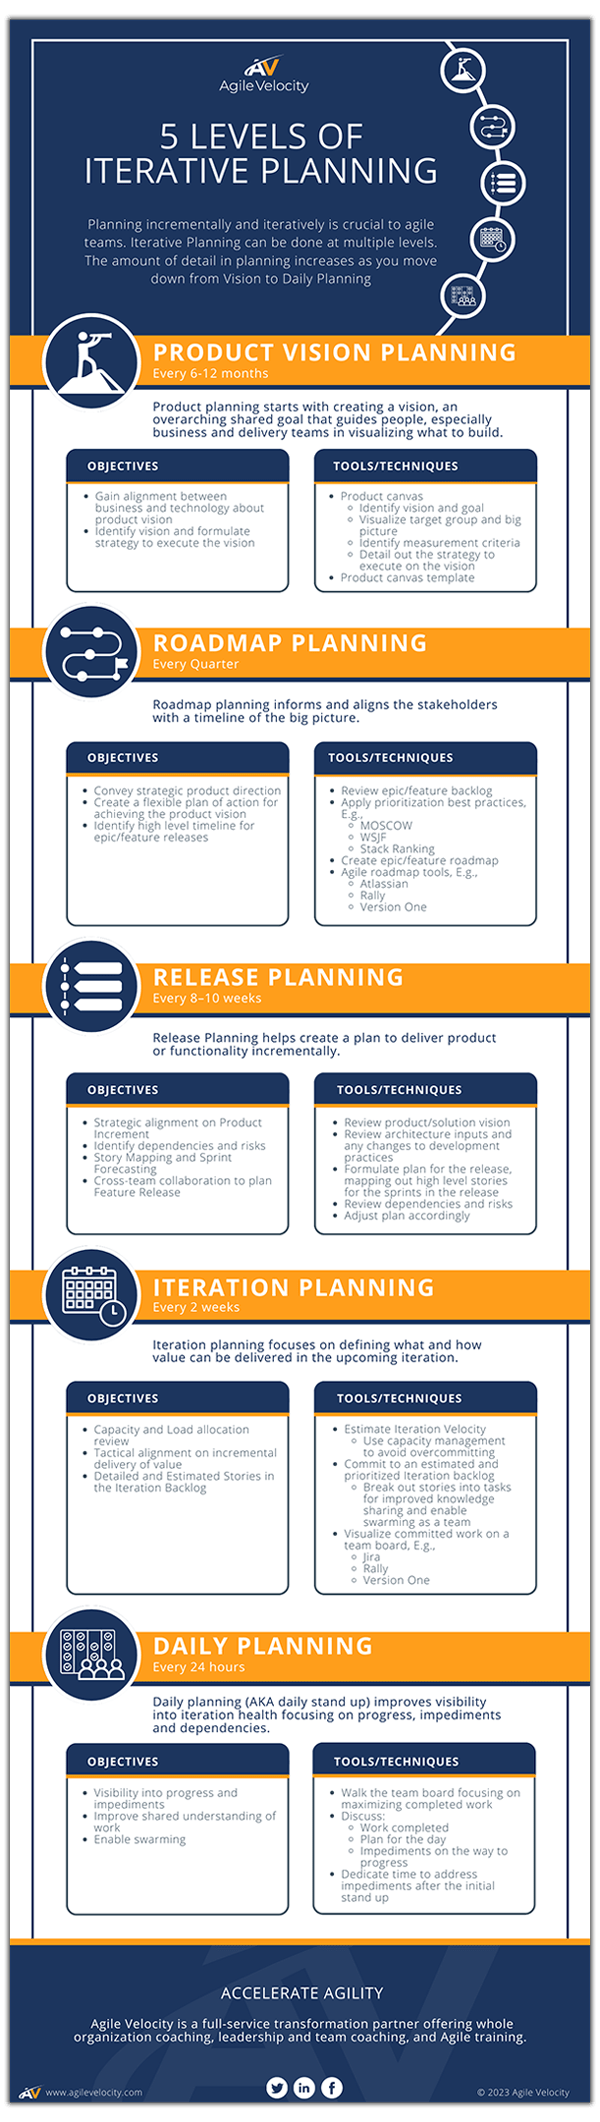
If you need help with Iterative Planning at any level, contact us to discuss how we can help you reach your desired business goals.

Blog
Can we talk? Tips & Tricks For Creating a Feedback-Rich Culture
By: Shelby Turk | Nov 17, 2022 | Agile

“I have some critical feedback for you that I’d like share. When would be a good time?”
Feedback loops are a key part of working in an Agile way. Creating a feedback rich environment is a responsibility of the full team, and is a integral element in having a high performance Agile team. The way that feedback is shared can be the difference between a growth experience (for both giver and receiver) and the beginning of a toxic spiral. Like most skills, giving feedback to your teammates is something that needs to be practiced – often.
I recently had to give someone important feedback, and it could not wait for the next roundtable review. It was sensitive and I knew the conversation was going to be a challenge for both parties. I reached out to my mentor to get coaching beforehand and got some advice that changed the way I look at feedback entirely.
“Honesty, candor, and respect. It’s a loving thing to do to give generous, constructive feedback.”
The intent behind the feedback was to grow our relationship and to safely bring light to a problem. With this lens, the conversation was still difficult for me to instigate, but it was in service of the recipient, not to spite them. It was now “us versus the problem” and it was up to us to come up with a solution.
Critical feedback is part of the groundwork for any great team, and below are some tips to help give critical, specific, and loving feedback to your teammates.
Plan What You Need to Say
Rough out in advance what you’d like to say. Write up an outline, or a rough draft. Then bounce it off of a coach, or a friend. Practice it out loud. How would it feel if you were on the receiving end?
Talk Face-to-Face (or Video-to-Video)
Text-based communication (Slack, email, etc.) is very useful, but also prone to misinterpretation. Without vocal tone, body language, and emotional inflection, it is easy to misread a situation. Face-to-face conversations have room for questions and empathy and are more likely to end in a positive outcome.
Present Observations, Not Interpretations
It’s easy to assign an intent or meaning to a situation. However, it’s better to present what you saw and allow them to give their perspective.
Example -“I’ve seen that your backlog is growing, can you share what’s going on?” is a much kinder way than “ “I know you have been overwhelmed with work”
Don’t Wait
When given the choice between having a hard conversation and doing anything else, it’s tempting to avoid the feedback. For feedback to be most effective, the memory needs to be fresh in both parties’ minds, so the conversation can be actionable and effective. By not letting days or weeks go by, the context (challenges, emotions, process, etc) is fresh and easy to discuss.
Set The Stage
While you don’t want to wait, you also don’t want to surprise someone with critical feedback. Letting the recipient know that you have critical feedback and allowing them to choose the meeting time gives them control and space to listen to the feedback you have. You can give a deadline but empowering the recipient can start the conversation in an open headspace.
Follow Up And Consistently Provide Feedback
Many of us can relate to the emotional flooding that follows receiving critical feedback. Allowing the recipient to leave the meeting and digest the message, and then checking back in the days following, creates a space of growth for both parties. Consistently giving, and receiving, feedback builds a stronger team. Each session builds deeper trust within the team and pushes the team to be better as a unit.
How To Build A Feedback Rich-Environment
I hope the tips above help you get better at providing valuable feedback. If you are interested in learning how to improve the feedback loops in your organization, contact us.